 kudhub
Dashboard component showcase
Start with a question. Combine filters, headline values, charts, and detail rows to answer it.
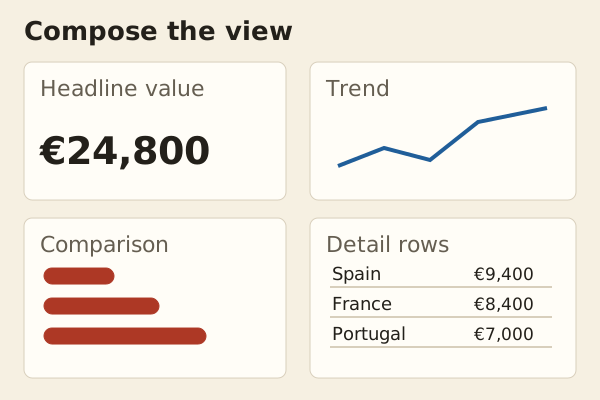
Illustrative components with fictional data. Explore the working dashboard to change filters.
Arrange the result
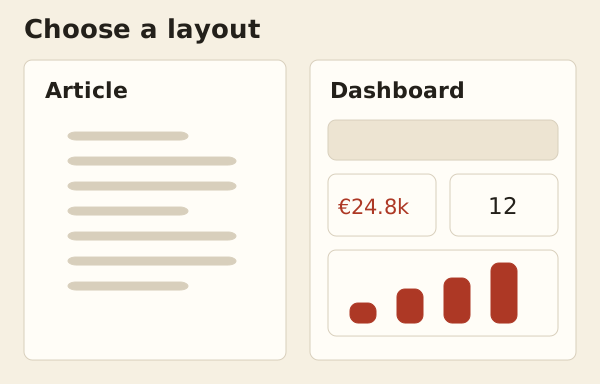
Use an article for a guide or report. Use a grid for comparisons. Both adapt to smaller screens.
Choose a template style
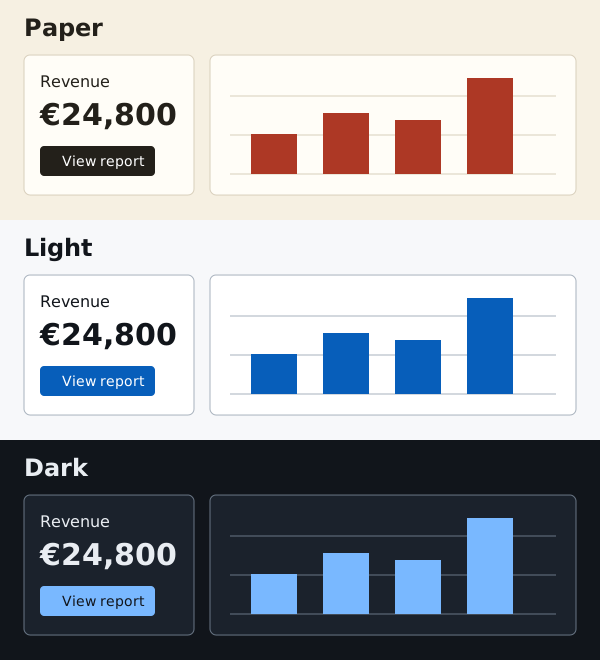
Ask for Paper, Light, or Dark with either layout. Your assistant can adapt the content, images, and components.
Explore maps and a larger dataset ↗
“Show revenue at the top, a trend underneath, and the orders behind it. Add a country filter.”
Also available: pivot tables, target values, maps, scatter plots, heatmaps, treemaps, and flow charts. The source below includes examples.
View complete Markdown source
Source for your assistant. Layout and component instructions are shown as code here; they do not execute in the documentation.
---
layout: full
theme: dark
components: cards
density: compact
toc: true
---
# Dashboard component showcase

This self-contained dashboard exercises the input types, SQL modes, and chart
families. Its SQL uses literal CTE data, so it renders without
account tables.

## Composable inputs

:::: {.cluster #filters}
```component_input name=segments type=select label="Segments" options="enterprise:Enterprise,smb:SMB,consumer:Consumer" multiple=true searchable=true group=filters
```

```component_input name=period type=radio label="Period" options="7:7 days,30:30 days,90:90 days" display=buttons default=30 group=filters
```

```component_input name=active type=checkbox label="Active only" display=toggle default=1 group=filters
```

```component_input name=min_score type=number label="Score range" range=true end_name=max_score default=10 default_end=90 min=0 max=100 step=5 display=slider group=filters
```

```component_input name=country type=select label="Country" options_query="WITH choices(value, label) AS (VALUES ('ES','Spain'),('FR','France'),('US','United States')) SELECT value, label FROM choices WHERE json_array_length(:segments) >= 0" default=ES group=filters
```
::::

```component_input name=from type=date label="Reporting dates" range=true end_name=to default=2026-09-01 default_end=2026-09-14 presets=true
```

## Existing components, new modes

:::: {.grid columns=3}
```component_sql type=value title="Quarterly target" label="of 100 target" progress=true
SELECT 72 AS current, 58 AS previous, 100 AS target;
```

::: {.cell span=2}
```component_sql type=table title="Revenue pivot" pivot=true row=team column=quarter value=revenue
WITH revenue(team, quarter, revenue) AS (
  VALUES ('North','Q1',42), ('North','Q2',57), ('North','Q3',64),
         ('South','Q1',35), ('South','Q2',51), ('South','Q3',59),
         ('West','Q1',28),  ('West','Q2',46),  ('West','Q3',55)
)
SELECT team, quarter, revenue FROM revenue;
```
:::
::::

:::: {.grid columns=2}
```component_sql type=line title="Filled, stacked trend" x=day fill=true stack=true
WITH trend(day, new_orders, renewals) AS (
  VALUES ('2026-09-01',18,11), ('2026-09-02',24,13),
         ('2026-09-03',21,17), ('2026-09-04',29,16),
         ('2026-09-05',33,19), ('2026-09-06',38,22)
)
SELECT day, new_orders, renewals FROM trend;
```

```component_sql type=bar title="Horizontal, stacked bars" orientation=horizontal stack=true
WITH channels(channel, new_orders, repeat_orders) AS (
  VALUES ('Direct',38,25), ('Partners',29,31), ('Marketplace',45,18), ('Retail',21,27)
)
SELECT channel, new_orders, repeat_orders FROM channels;
```
::::

## New chart families

:::: {.grid columns=2}
```component_sql type=map title="World regions" region_key=iso_a3 height=360
WITH totals(region, value) AS (
  VALUES ('ESP',72), ('DEU',61), ('USA',88), ('BRA',54),
         ('IND',79), ('JPN',68), ('AUS',47), ('ZAF',39)
)
SELECT region, value FROM totals;
```

```component_sql type=map mode=markers title="Geographic markers" height=360
WITH locations(longitude, latitude, value, label) AS (
  VALUES (-3.7038,40.4168,42,'Madrid'), (2.3522,48.8566,64,'Paris'),
         (-74.0060,40.7128,88,'New York'), (139.6917,35.6895,57,'Tokyo'),
         (151.2093,-33.8688,36,'Sydney')
)
SELECT longitude, latitude, value, label FROM locations;
```

::: {.cell span=2}
```component_sql type=scatter title="Bubble scatter" height=360
WITH products(x, y, label, size, series) AS (
  VALUES (12,72,'Atlas',38,'Core'), (24,65,'Beacon',26,'Core'),
         (38,81,'Comet',44,'Core'), (19,42,'Delta',20,'Growth'),
         (34,54,'Ember',32,'Growth'), (49,69,'Flux',40,'Growth')
)
SELECT x, y, label, size, series FROM products;
```
:::
::::

:::: {.grid columns=2}
```component_sql type=heatmap title="Matrix heatmap" height=250
WITH activity(x, y, value) AS (
  VALUES ('Mon','Morning',28), ('Tue','Morning',41), ('Wed','Morning',37),
         ('Thu','Morning',49), ('Fri','Morning',55), ('Mon','Afternoon',44),
         ('Tue','Afternoon',52), ('Wed','Afternoon',61), ('Thu','Afternoon',58),
         ('Fri','Afternoon',67), ('Mon','Evening',19), ('Tue','Evening',26),
         ('Wed','Evening',32), ('Thu','Evening',39), ('Fri','Evening',46)
)
SELECT x, y, value FROM activity;
```

```component_sql type=heatmap mode=calendar title="Calendar heatmap" height=250
WITH activity(date, value) AS (
  VALUES ('2026-09-01',4), ('2026-09-02',7), ('2026-09-03',3),
         ('2026-09-04',9), ('2026-09-05',12), ('2026-09-06',8),
         ('2026-09-07',15), ('2026-09-08',11), ('2026-09-09',17),
         ('2026-09-10',13), ('2026-09-11',19), ('2026-09-12',16)
)
SELECT date, value FROM activity;
```
::::

:::: {.grid columns=2}
```component_sql type=treemap title="Revenue hierarchy" height=360
WITH hierarchy(id, parent, label, value) AS (
  VALUES ('products',NULL,'Products',NULL), ('services',NULL,'Services',NULL),
         ('hardware','products','Hardware',46), ('software','products','Software',72),
         ('support','services','Support',31), ('consulting','services','Consulting',53)
)
SELECT id, parent, label, value FROM hierarchy;
```

```component_sql type=sankey title="Acquisition flow" height=360
WITH flow(source, target, value) AS (
  VALUES ('Visitors','Trials',82), ('Visitors','Docs',38),
         ('Docs','Trials',21), ('Trials','Active',57),
         ('Trials','Churned',25), ('Active','Expanded',34)
)
SELECT source, target, value FROM flow;
```
::::